Richardson — AI at work (Reuters Econ World, Oct 2026)
▶ Watch on YouTube · Reuters · 31:26
AI is already changing the labor market, but not in the way many people expect. Nela Richardson, chief economist at ADP, joins host Carmel Crimmins to explain why AI appears to be reshaping tasks rather than eliminating jobs, why younger workers are feeling the impact first, and why experience is proving more valuable in the age of artificial intelligence than many economists predicted.
— channel description, Reuters (hashtags and links omitted)
TL;DR
A ~31-minute episode of Reuters Econ World on the Reuters channel, published 7 October 2026. The host is Carmel Crimmins; the guest is Nela Richardson, chief economist at the payroll firm ADP, whose payroll records are the data behind Canaries in the Coal Mine. The captions are auto-generated, with proper nouns corrected at acquire time. Reuters cut nine data charts into the video; they are verified and published below, and they carry most of the episode’s numbers.
1. “Better to use a microscope than a telescope” (1:22–3:06). The changes are “at the task level. They’re very minute. You’re not seeing them in the overall productivity numbers yet.” ADP and “our partners at Stanford” sort payroll data by occupation (AI exposure) and by career stage. The pattern: employment of young people in highly exposed fields (software developers, customer service reps) has fallen; young people in non-exposed fields such as home health and nursing aides have gained; and in older career stages AI exposure seems to raise employment: “It’s augmentative.”
2. The latest figures (3:39–4:07). In ADP’s August report, year-over-year employment of young people in AI-exposed fields fell 4.4%, and in non-exposed fields 2%. Her reading is that AI “seems to reinforce knowledge and expertise”. Before 2026 her prior had been the opposite: firms would drop “all the expensive older people” and hire young people with the new tools. “That’s not what’s happening.” The tasks that go are the ones “that don’t require experience, that don’t require judgment.”
3. A wage premium inside exposed work (6:00–6:39). Within the digital job category, ML and AI occupations earn “a huge wage premium versus other digital jobs.”
4. Tasks, not jobs (7:24–8:15). Her hypothesis: “what we’re going to be talking about in the labor market is how many tasks are created and destroyed, not how many jobs.” ADP has unbundled IT jobs into tasks: developing, design and creation are high-value; explaining, documentation and diagnostics are low-value. Some high-value tasks have lost value since ChatGPT, “like explaining technological advances. There’s AI for that.” Employers should upskill early-career staff to the high-value tasks rather than turn over the workforce in search of new skills.
5. The human-capital argument (10:08–11:41). Asked about the Jevons paradox and radiologists, she agrees AI could create jobs but says “we’re not on a preset pathway to that.” Her history: US labour productivity was lowest in the late 1970s and early 1980s, when the boomers entered the labour market as “the largest unskilled workforce… in human history”, and highest in the internet boom, when those workers had about 30 years of experience. “We don’t have 30 years to scale up young people to take advantage of AI. We have to do it now.” She calls this “the missing part of the equation for why AI isn’t showing up in the productivity numbers.”
6. Mass layoffs as a one-off (12:09–13:24). Possible, “but only if people are shortsighted and they pick the lowest hanging fruit. The thing about using AI purely for an efficiency play is you can only do it once. You lay off your workforce, you have a great quarter, and then what?”
7. Where the wage premiums are (16:24–18:21). In construction trades tied to the AI build-out, and in manufacturers upstream of it. The cause is demand meeting limited supply: older tradespeople retiring (“10,000 people are turning 65 and older every single day”) and less immigration. ADP matches individuals over time, so it can measure the pay rise of people who switch jobs: “Premiums in construction are hitting almost 14% for gross pay.”
8. Ageing matters more than AI right now (16:57–21:52). “If I could think of two A’s that are most impacting the labor market right now, AI or aging, it would be aging hands down.” Three of every four net new US jobs in recent years have been in healthcare, driven by a large, wealthy retiree class that chooses to age at home.
9. Inequality starts from real-wage losses (22:44–24:26). Research with the University of Chicago: during the 2021–2024 inflation, 43% of workers saw real wage declines, averaging 8%. Workers usually outrun inflation by switching jobs, and in a low-hire, low-fire market there is less chance to do that, “they can’t really capture the benefit of AI.”
10. Trust (24:29–26:13). Crimmins cites “Anthropic’s IPO prospectus”, which asserts the technology will transform the economy more than electricity or the internet. Richardson answers that adoption depends on trust: “if we have products that say that they’re going to end humanity, people aren’t going to trust it.”
11. Advice (26:20–29:32). Young people should lean into networking, informational interviews and “going back to people and relationships.” Employers should find where their value creation lies and upskill toward it. On displacement: “People talk about durable jobs. There’s no such thing. But durable skills, that’s something that we can build.” What may differ this time: “you can use AI to help people displaced by AI.”
The episode closes with a quiz: Keynes’s 1930 prediction of a 15-hour week by 2030.
Visual canon
The Gemini scan found ten charts, all Reuters inserts, not the guest’s slides. Nine are published; a UN/World Bank chart of population ageing in seven countries is left out as background. Gemini’s readings matched the pixels; it left out the notes on the OECD and Gallup charts, which are added here. Values not printed on a chart are read from line positions and are approximate.
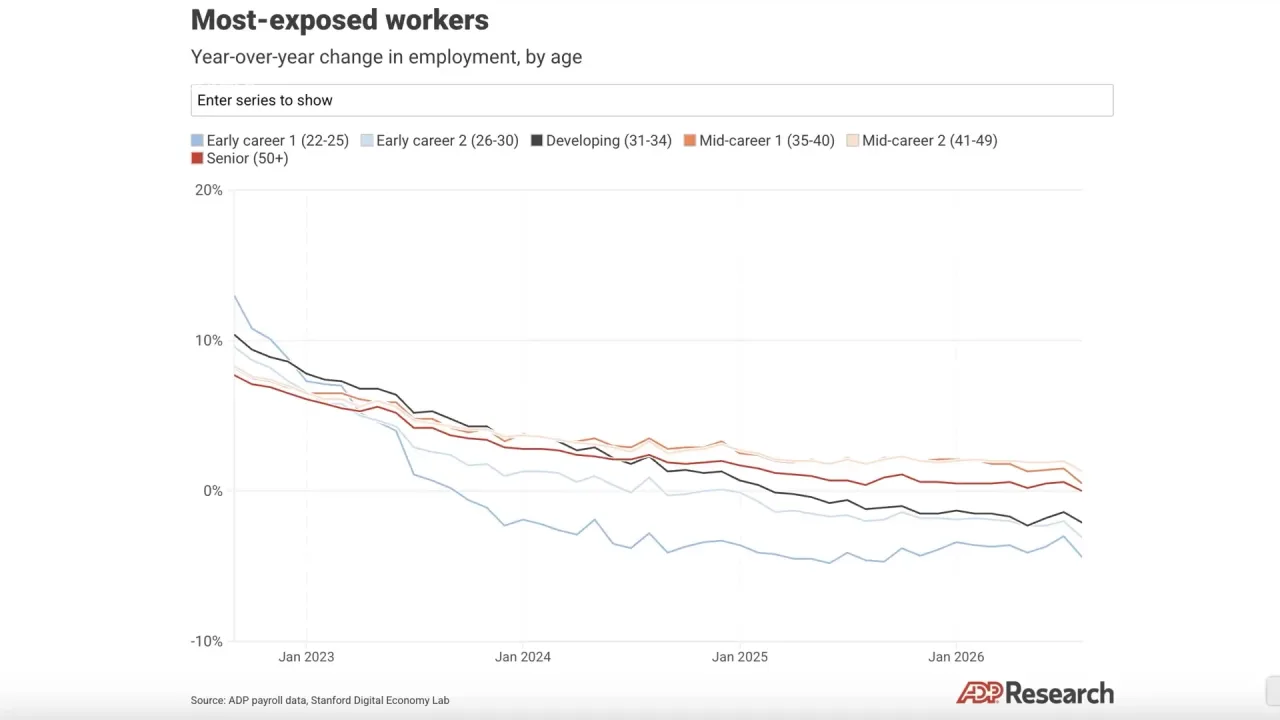
1 · Most-exposed workers
Still at 3:57 from Reuters, “AI at work | Econ World”.
Most-exposed workers. Year-over-year change in employment, by age. Six series: Early career 1 (22–25), Early career 2 (26–30), Developing (31–34), Mid-career 1 (35–40), Mid-career 2 (41–49), Senior (50+). Axis −10% to 20%, late 2022 to mid-2026. Source: ADP payroll data, Stanford Digital Economy Lab. ADP Research.
Read from the lines: all six start between about +8% and +13% in late 2022 and fall together through 2023. The 22–25 group drops below zero in late 2023 and ends near −4.4%. The 26–30 and 31–34 groups end at about −3% and −2%, the 50+ group at about 0%, and the two mid-career groups slightly above zero.
Still vs. transcript: Richardson gives the −4.4% for the youngest group. The chart shows the ordering by age across all six groups, and that every group’s growth slowed, not only the youngest.
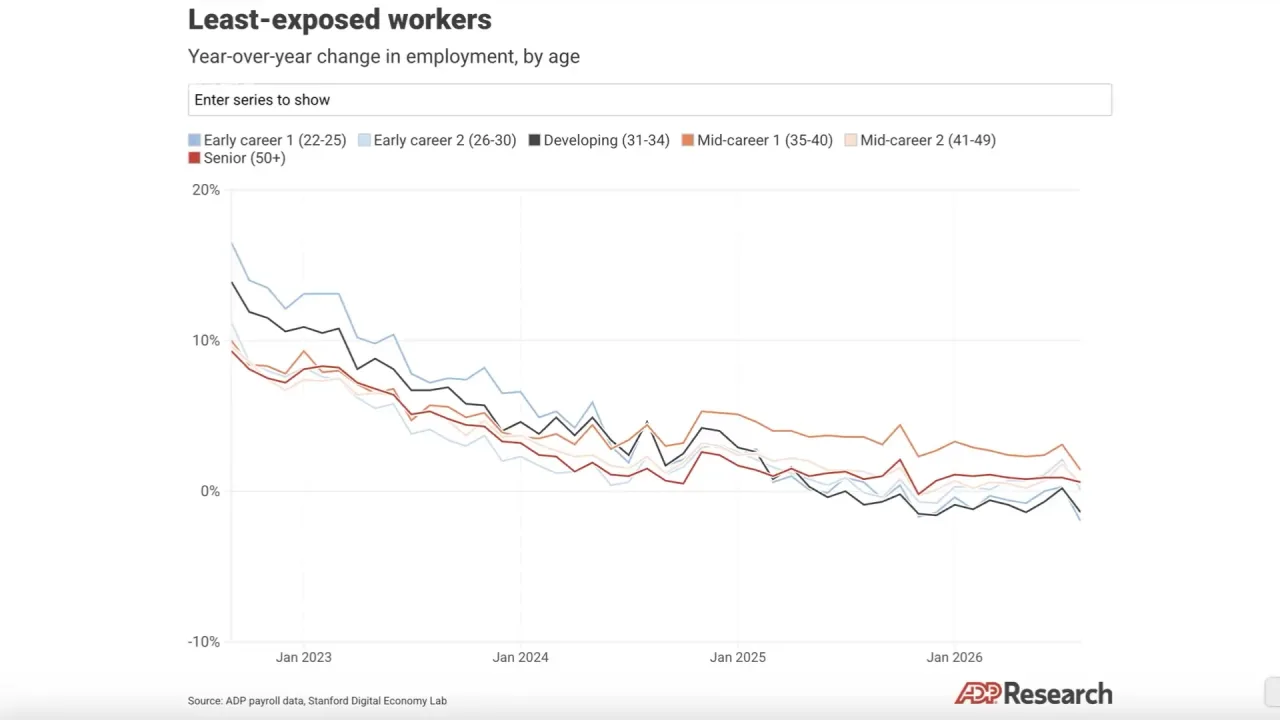
2 · Least-exposed workers
Still at 4:10 from Reuters, “AI at work | Econ World”.
Least-exposed workers. Same series, axis and source as chart 1. The 22–25 group starts highest, at about +16% in late 2022, and ends at about −2%. Only the 35–40 group stays clearly positive (about +1.5%); the others end between about −1.5% and +1%.
Still vs. transcript: the narration gives the −2%. The chart shows that in the least-exposed group the young fell from the highest growth rate to the lowest, while the spread between age groups stayed narrow. In chart 1 that spread is wide.
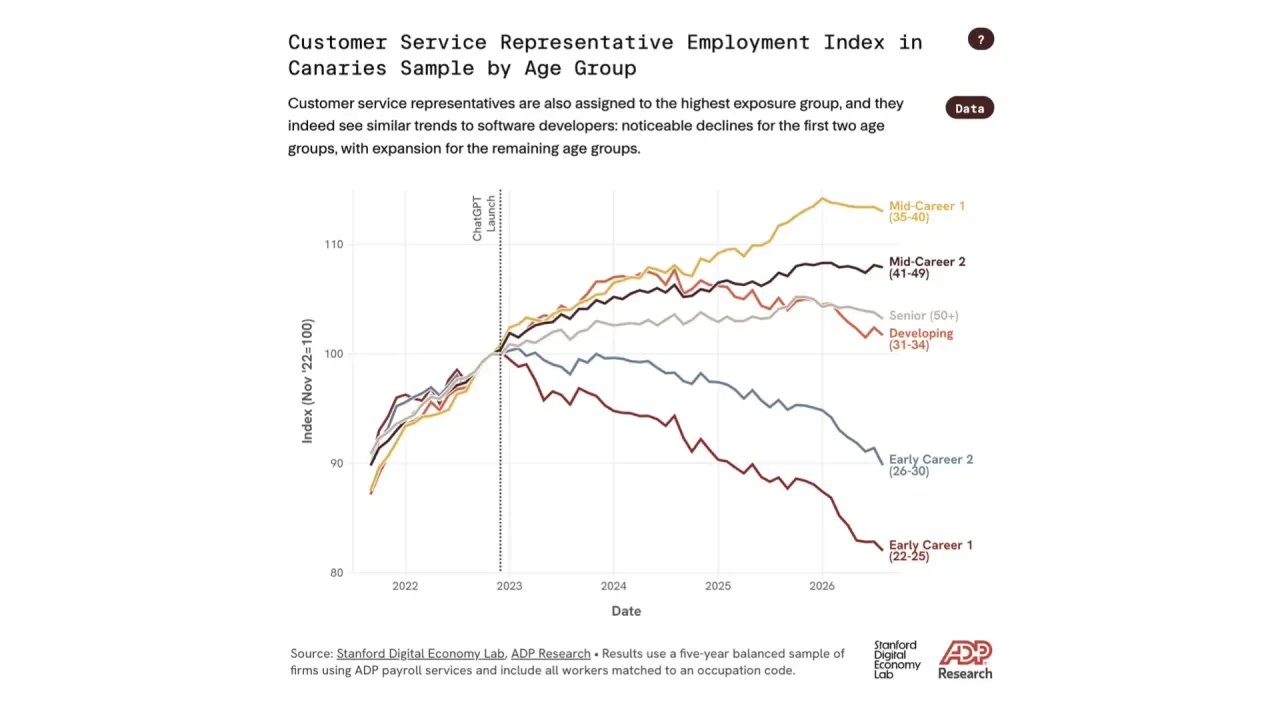
3 · Customer service representatives
Still at 5:26 from Reuters, “AI at work | Econ World”.
Customer Service Representative Employment Index in Canaries Sample by Age Group. Caption on the chart: “Customer service representatives are also assigned to the highest exposure group, and they indeed see similar trends to software developers: noticeable declines for the first two age groups, with expansion for the remaining age groups.” Index, Nov ‘22 = 100, with the ChatGPT launch marked. End values, mid-2026: Early Career 1 (22–25) about 82; Early Career 2 (26–30) about 90; Developing (31–34) about 101; Senior (50+) about 103; Mid-Career 2 (41–49) about 108; Mid-Career 1 (35–40) about 113. Source: Stanford Digital Economy Lab, ADP Research. Results use a five-year balanced sample of firms using ADP payroll services and include all workers matched to an occupation code.
Still vs. transcript: the narration names customer service reps as an exposed occupation. The chart gives the size: roughly an 18% fall in employment of 22–25-year-olds since November 2022, against growth of 3–13% for workers over 30.
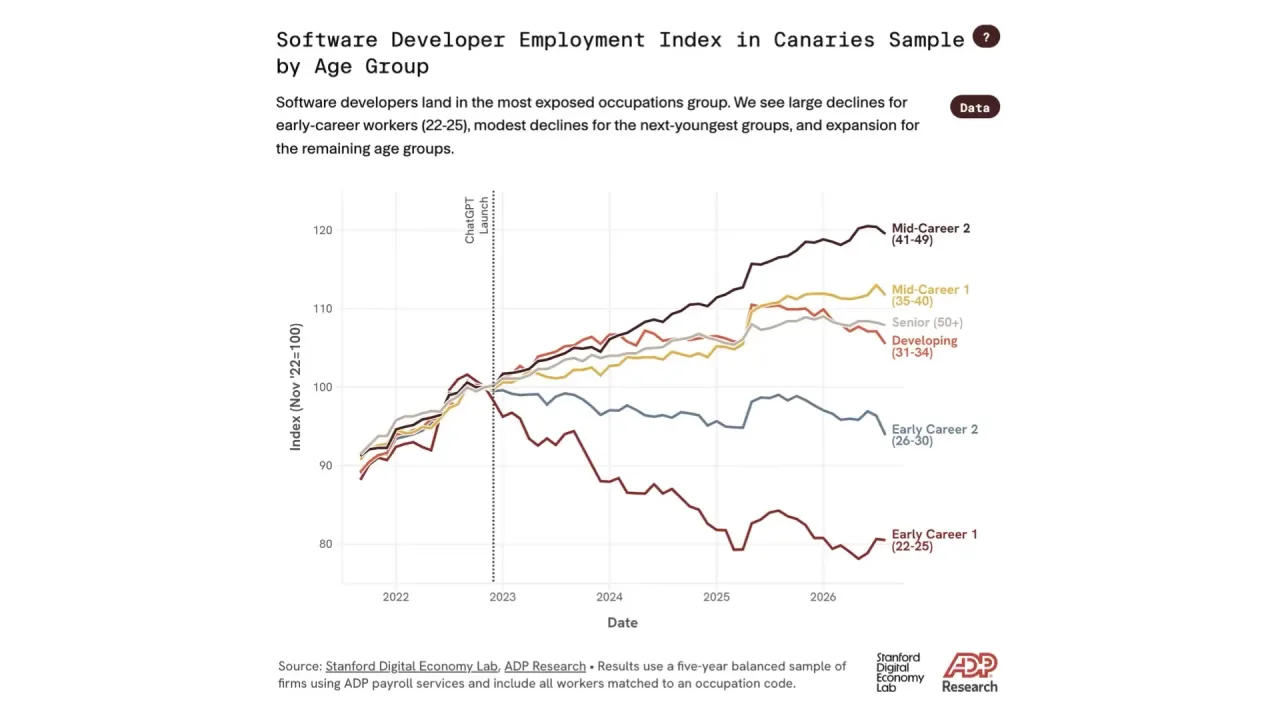
4 · Software developers
Still at 6:33 from Reuters, “AI at work | Econ World”.
Software Developer Employment Index in Canaries Sample by Age Group. Caption: “Software developers land in the most exposed occupations group. We see large declines for early-career workers (22-25), modest declines for the next-youngest groups, and expansion for the remaining age groups.” End values: Early Career 1 about 80 (low of about 78 in 2026); Early Career 2 about 94; Developing about 105; Senior about 108; Mid-Career 1 about 112; Mid-Career 2 (41–49) about 120. Same source and sample note as chart 3.
Still vs. transcript: Canaries reported a ~13% relative decline to July 2025. This chart runs the absolute index a year further: 22–25-year-old developers are about 20% below November 2022, and 41–49-year-olds about 20% above.
5 · OECD productivity scenarios for the G7
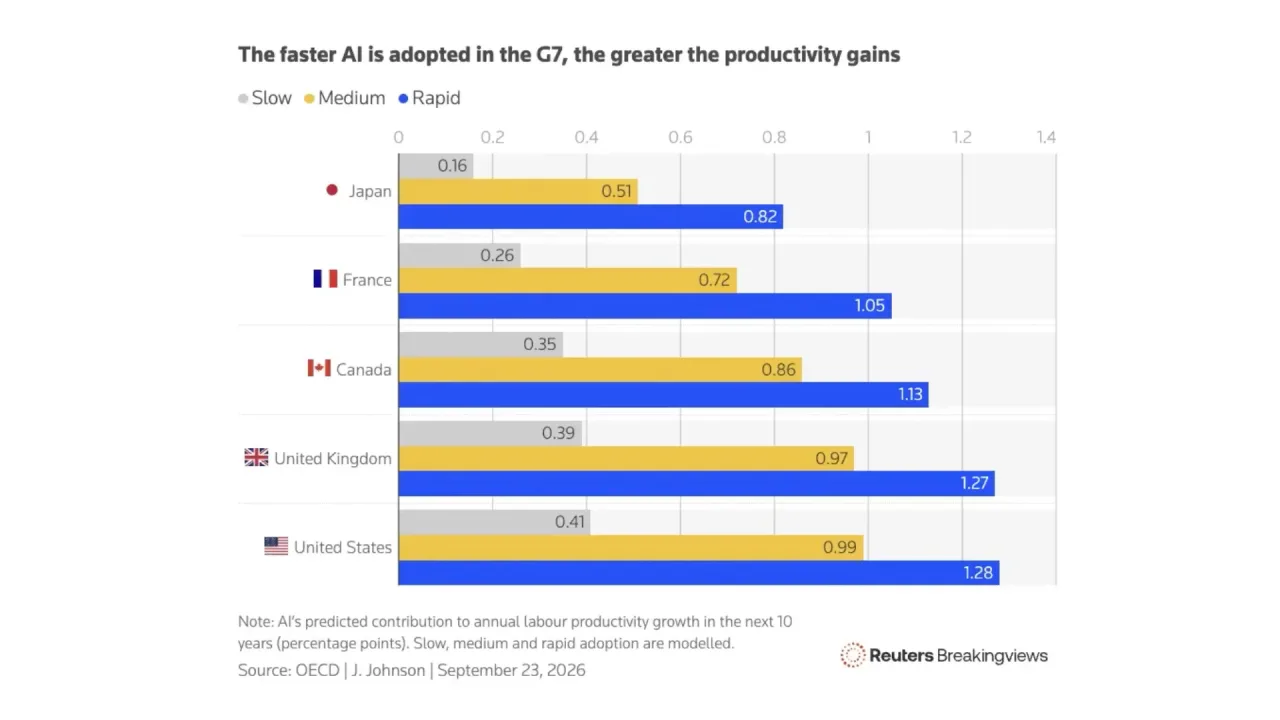
Still at 7:25 from Reuters, “AI at work | Econ World”.
The faster AI is adopted in the G7, the greater the productivity gains.
| Slow | Medium | Rapid | |
|---|---|---|---|
| Japan | 0.16 | 0.51 | 0.82 |
| France | 0.26 | 0.72 | 1.05 |
| Canada | 0.35 | 0.86 | 1.13 |
| United Kingdom | 0.39 | 0.97 | 1.27 |
| United States | 0.41 | 0.99 | 1.28 |
Note: AI’s predicted contribution to annual labour productivity growth in the next 10 years (percentage points). Slow, medium and rapid adoption are modelled. Source: OECD | J. Johnson | September 23, 2026. Reuters Breakingviews.
Still vs. transcript: not narrated. It appears while Richardson says productivity is “the end state” but “you sure ain’t seeing it there yet.” The OECD’s spread between slow and rapid adoption is a factor of three to five in every country.
6 · Low hire, low fire
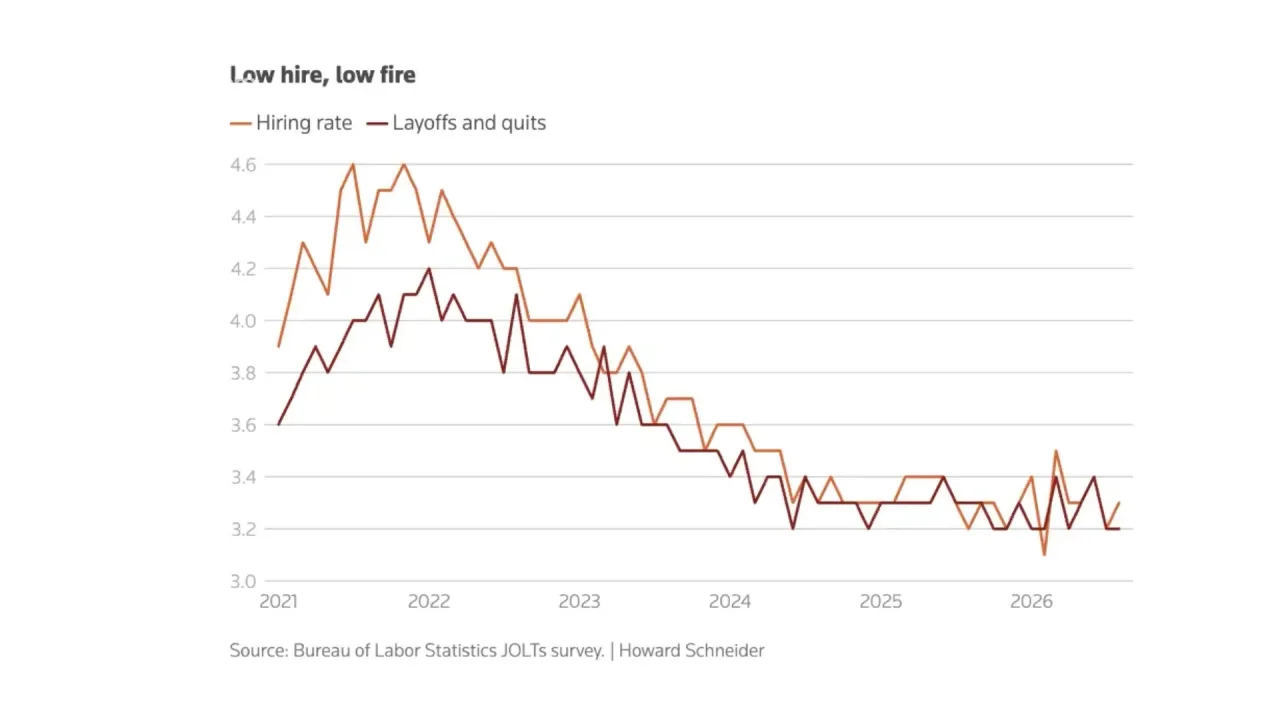
Still at 15:05 from Reuters, “AI at work | Econ World”.
Low hire, low fire. Hiring rate and layoffs-and-quits rate, 2021 to mid-2026, axis 3.0–4.6. The hiring rate peaks at 4.6 in 2021–22 and the layoffs-and-quits rate at 4.2 in early 2022. Both fall to about 3.2–3.4 from mid-2024 and stay there. Source: Bureau of Labor Statistics JOLTs survey. | Howard Schneider.
Still vs. transcript: Richardson uses the phrase twice. The chart shows how long the condition has lasted: two years of hiring and separations both near 3.3%. She ties this to inequality: workers who cannot switch jobs cannot capture wage gains.
7 · Construction job-changers
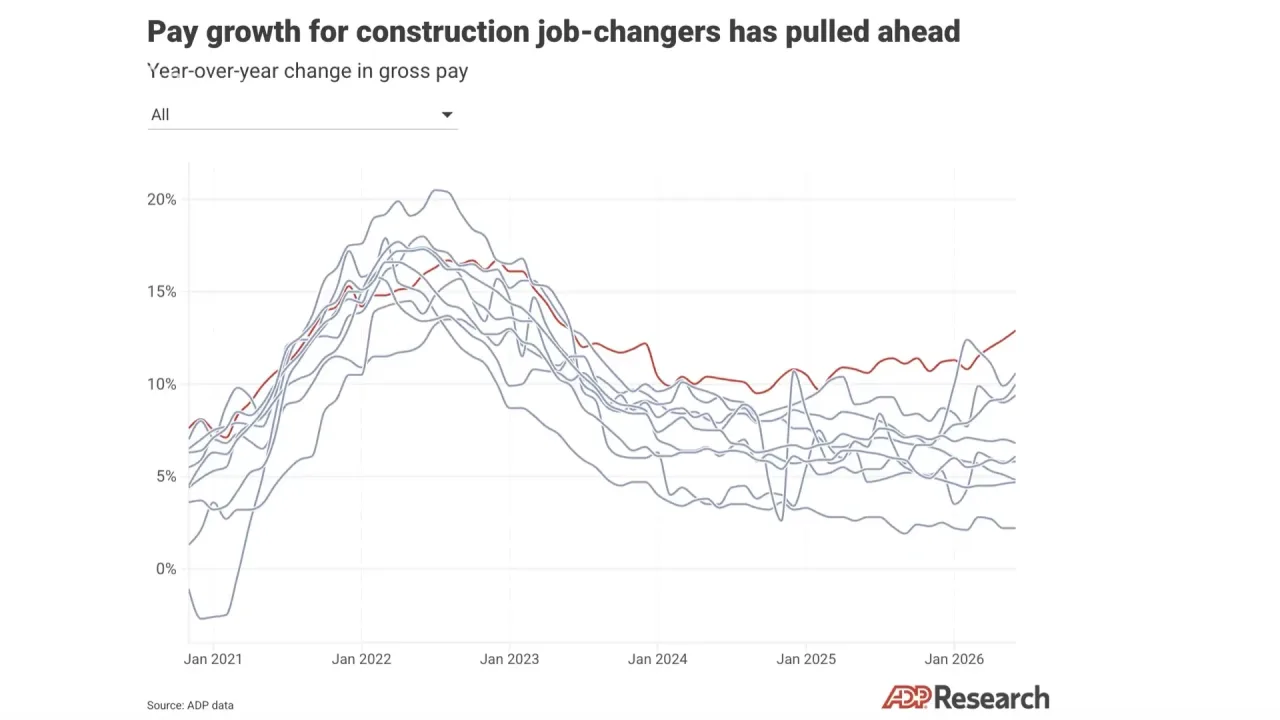
Still at 17:52 from Reuters, “AI at work | Econ World”.
Pay growth for construction job-changers has pulled ahead. Year-over-year change in gross pay, January 2021 to mid-2026. Construction (red) against about nine other sectors (grey, unlabelled). All peak at about 13–20% in 2022. From 2024 construction stays at about 10–11% while the others fall to about 2–9%, and it rises to about 13% by mid-2026. Source: ADP data. ADP Research.
Still vs. transcript: Richardson says “almost 14%“. The chart shows that the construction premium is a divergence that opened in 2024, not a return to the 2022 peak.
8 · Home health aides
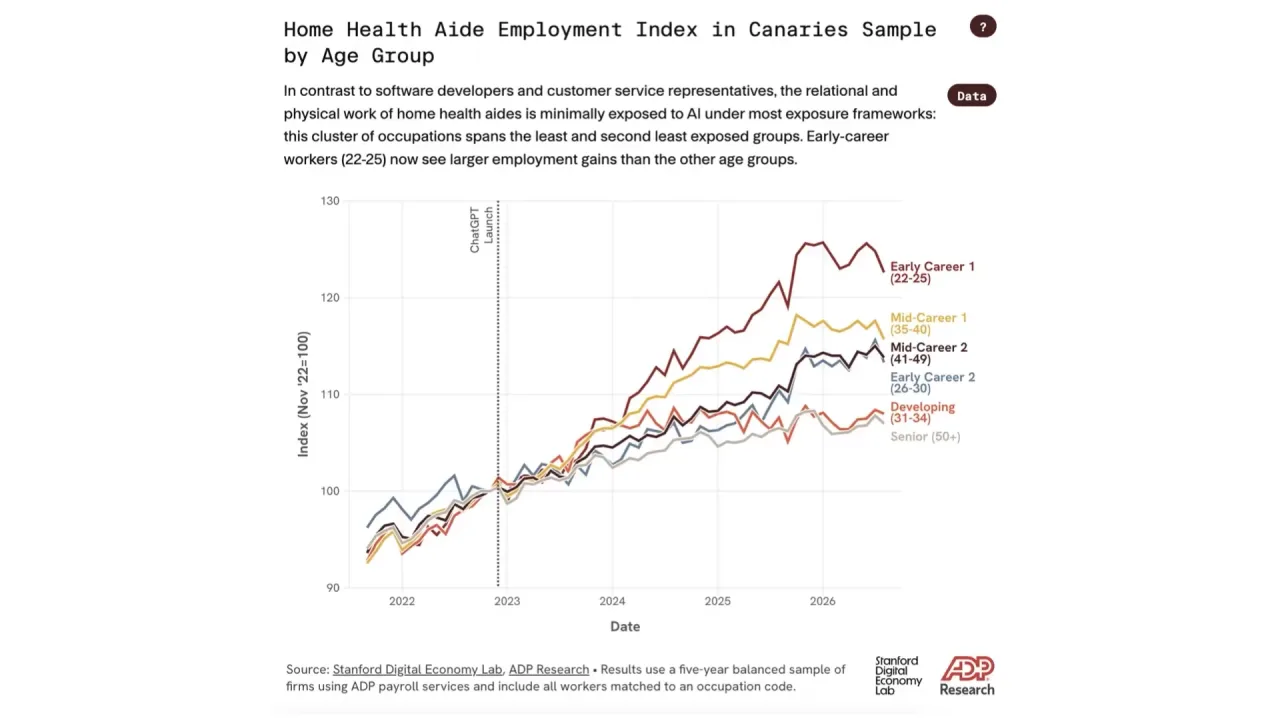
Still at 21:25 from Reuters, “AI at work | Econ World”.
Home Health Aide Employment Index in Canaries Sample by Age Group. Caption: “In contrast to software developers and customer service representatives, the relational and physical work of home health aides is minimally exposed to AI under most exposure frameworks: this cluster of occupations spans the least and second least exposed groups. Early-career workers (22-25) now see larger employment gains than the other age groups.” End values: Early Career 1 about 123 (peak about 126); Mid-Career 1 about 116; Mid-Career 2 and Early Career 2 about 114; Developing about 108; Senior about 107. Same source and sample note as chart 3.
Still vs. transcript: the narration says young people in non-exposed fields are gaining. The chart puts the youngest group’s growth at about 23% since November 2022, the fastest of any age group in this occupation.
9 · Trust among non-users
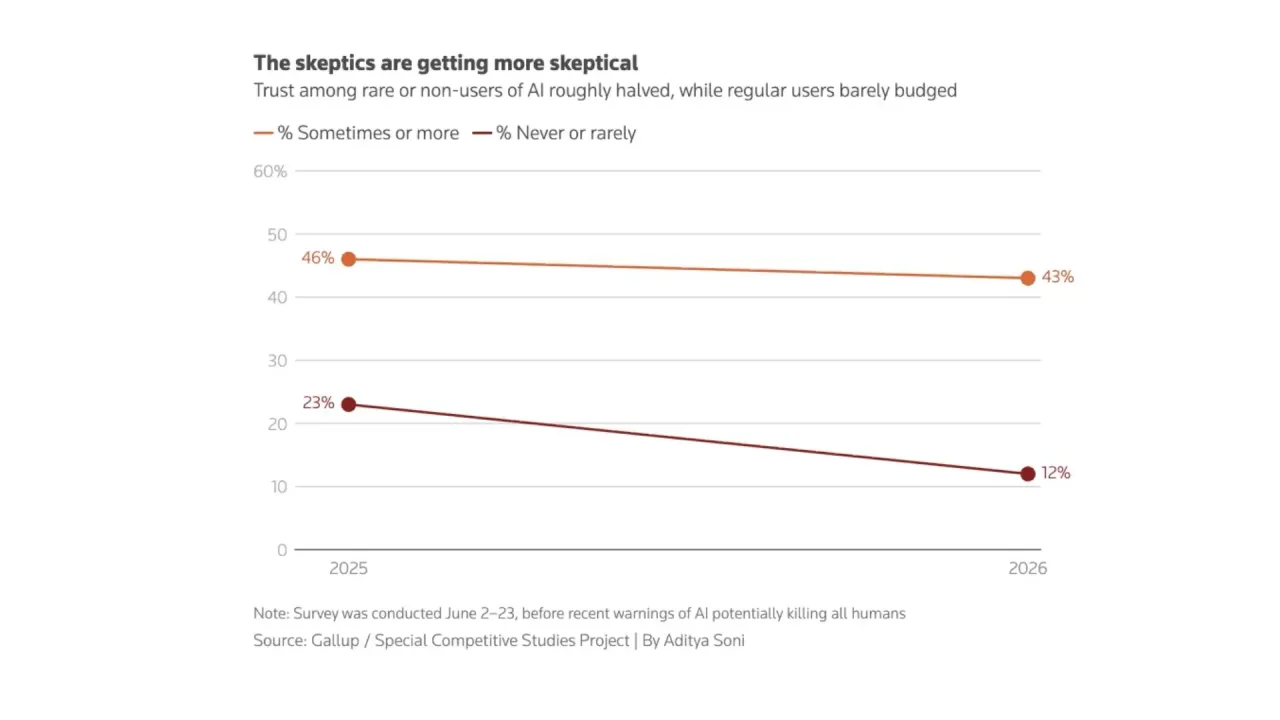
Still at 25:12 from Reuters, “AI at work | Econ World”.
The skeptics are getting more skeptical. “Trust among rare or non-users of AI roughly halved, while regular users barely budged.” % Sometimes or more: 46% → 43%. % Never or rarely: 23% → 12%. 2025 to 2026. Note: Survey was conducted June 2–23, before recent warnings of AI potentially killing all humans. Source: Gallup / Special Competitive Studies Project | By Aditya Soni.
Still vs. transcript: it appears while Richardson argues that adoption depends on trust. The chart gives the numbers: trust among people who rarely or never use AI fell by about half in a year, while trust among regular users held.
Dynamic-capabilities reading
digital-transforming/improving-digital-maturity. Richardson’s prescription to employers is workforce maturity: unbundle jobs into tasks, find where value is created, and upskill early-career staff to the high-value tasks rather than replace them. She calls missing investment in people “the missing part of the equation” for the productivity gap.contextual/external-triggers. The episode places AI among external labour-market forces that currently weigh more: an ageing workforce, limited immigration, two years of low hiring and low separations, and the data-centre build-out pulling construction wages up.
Related in this wiki
- Brynjolfsson, Chandar & Chen — Canaries in the Coal Mine: the paper built on the same ADP payroll data with the Stanford Digital Economy Lab. Charts 3, 4 and 8 carry its name and run its occupation series to mid-2026.
- Goldman Sachs (Sep 2026): another chief economist on AI in aggregate labour data. Hatzius reports small occupation-level correlations; Richardson says the effect is at the level of tasks and career stages.
- Brynjolfsson, Li & Raymond — Generative AI at Work: the customer-service study Richardson refers to, in which AI help raised the performance of low-performing agents most.
- BCG So What (Oct 2026): a day earlier, a BCG partner on substitution as a temporary cost advantage and augmentation as a compounding one. Richardson makes the same contrast in labour-market terms.
- Stanford HAI (Sep 2026): Karunakaran argues that jobs are more than bundles of tasks. Richardson proposes the task as the unit for measuring AI’s labour-market effect. The two use the same unit and disagree on whether it is enough.
Linked entities and concepts
- Entities: Reuters (channel; entity page created with this ingest, its second source as author), Stanford Digital Economy Lab (ADP’s research partner, credited on four charts).
- Concepts: ai-employment-effects (early-career decline by exposure, task-level change, ageing as the larger force), automation-vs-augmentation (“It’s augmentative” for older workers), durable-skills (“durable jobs… there’s no such thing”), micro-productivity-trap (productivity not yet visible).
- Dangling (single-source mention, deferred): Nela Richardson, Carmel Crimmins, ADP (as an organisation). ADP is cited as a data source on twelve source pages without a page of its own.
Debates and supersession
- Does the effect show in aggregate data? This episode sides with the reconciliation ai-employment-effects proposed between Canaries and Hatzius: the effect is concentrated by age within exposed occupations and does not show in aggregates. Richardson is ADP’s chief economist, and ADP supplies Canaries’ data, so she is not an independent check on that data.
- Both exposure groups’ young workers are shrinking. The −4.4% (exposed) and −2% (non-exposed) figures, and charts 1 and 2, show that 22–25-year-olds lost ground in both groups. The gap between them, not the decline itself, is what is attributed to AI. Richardson also names a general low-hire market for young people (“a tough labor market for young people for a variety of reasons”).
- A dating slip. Richardson dates the ChatGPT release to “October of 2023”; it was November 2022, as the charts mark. Left as spoken in the transcript.
- The OECD chart is a model. It shows predicted contributions under three adoption scenarios, not measurements.
- No supersession.
What was actually ingested
The full auto-generated English track: 245 segments, 0:00–31:12 of 31:26, no creator chapters. Two voices; attributions are clear from the question-and-answer format. Ten stills from a full Gemini scan (176,793 tokens), all viewed and checked; nine published. The video otherwise shows a video call with the guest.