Module 2 Business Problems and Data Science Solutions
2.1 Opening Business Case
In the following video you’ll hear an expert’s thoughts on the relation between business problems and data challenges.
Assignments:
- Write down all associations you can discover between the study material (Provost Ch.2) and the video.
- What is the relation between business problems and data challenges?
- What questions could be asked during data understanding?
2.3 The Data Mining Process
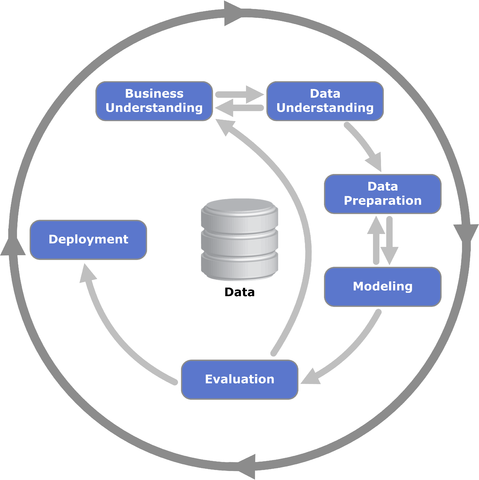
Figure 2.1: CRISP-DM Model taken from: https://commons.wikimedia.org/wiki/File:CRISP-DM_Process_Diagram.png
2.3.1 Formulating a business problem
Business Case: Recognizing handwritten digits
| Mnemonic | Question | Answer |
|---|---|---|
| E | Expectation: Why does the user want the information? | A utility company wants to scan the electricity meter readings it receives from clients through paper forms and save them to a database |
| C | Client Group: For whom is the service / product intended? | The Billing Department |
| L | Location: Where is the service / product sited? | This is an internal process |
| I | Impact: What would represent success? How is this measured? | To reach at least human accuracy |
| P | Professionals: Who provides or improves the service / product? | At the moment this is done by hand |
| SE | Service: What type of service / product is under consideration? | The readings are used to prepare invoices |
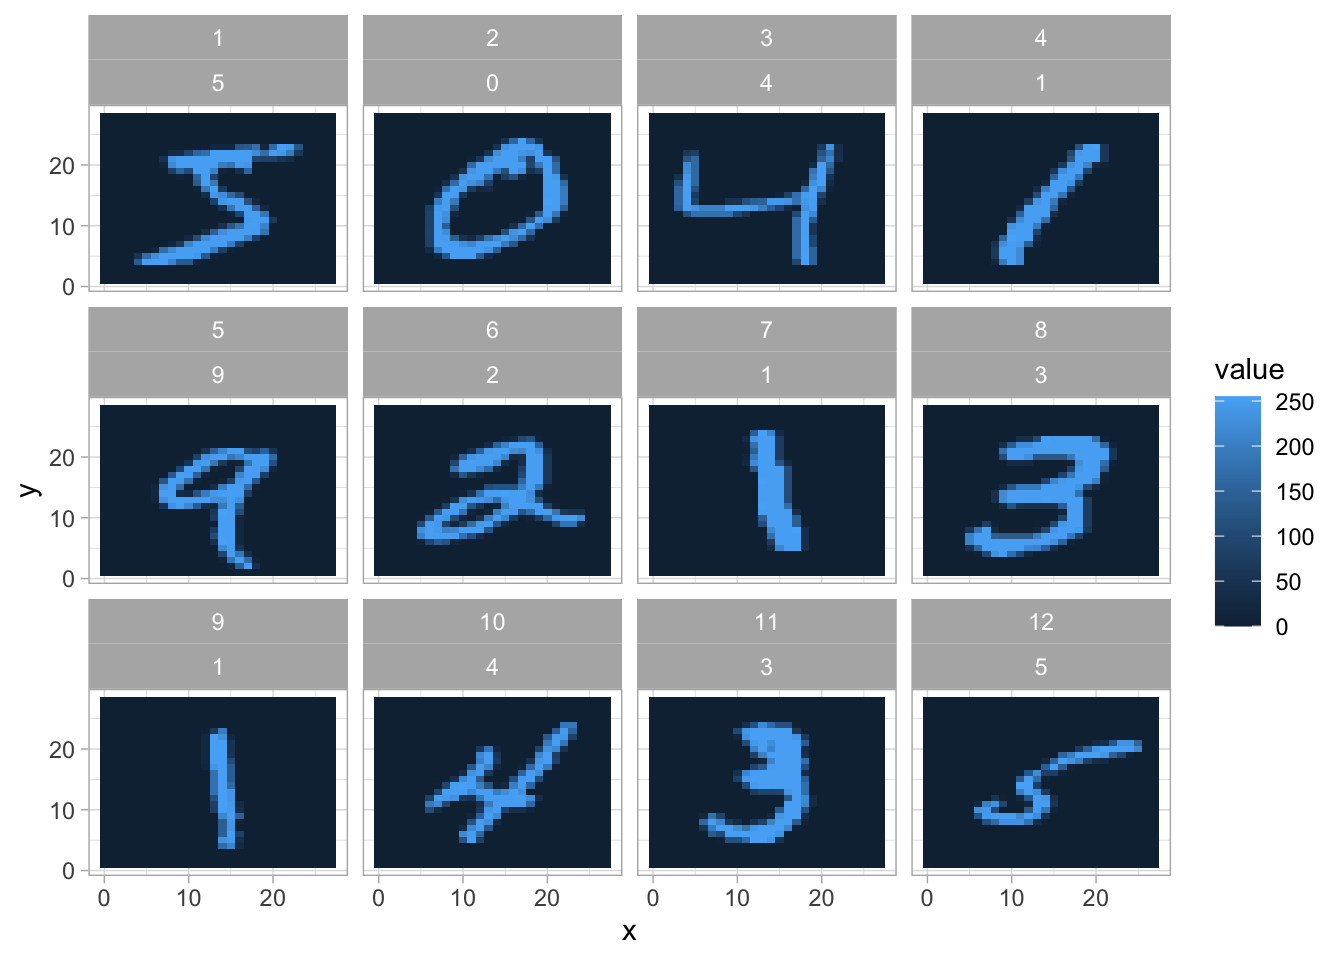
2.3.2 Data Understanding
We are going to train a model on data from the MNIST database (LeCun 1998). The original dataset contains 60000 images of handwritten digits. The size of each images is 28x28 pixel and each pixel has a grayscale value between 0 (white) en 255 (black).
2.3.3 Data Preparation
How much gray is there in the set of images?
Example Mnist Robinson (2018)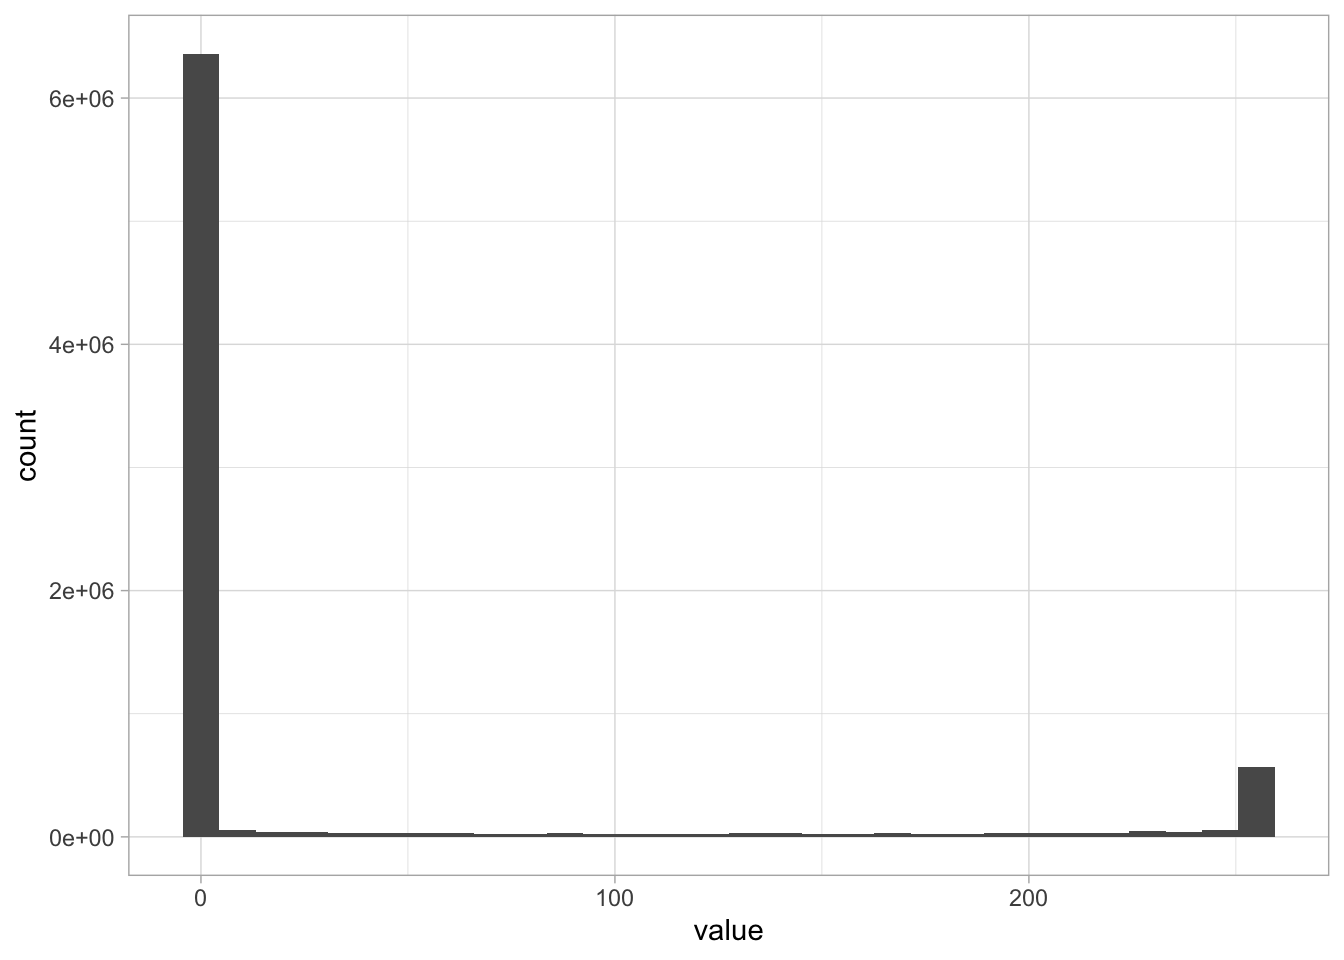
Solution
Before checking, analyze the chart and draw your own conclusions.
Most pixels in the dataset are completely white, along with another set of pixels that are completely dark, with relatively few in between.
Think: Let’s assume the images were black and whit photographs of landscapes or faces. Would you expect the same color distribution as above?
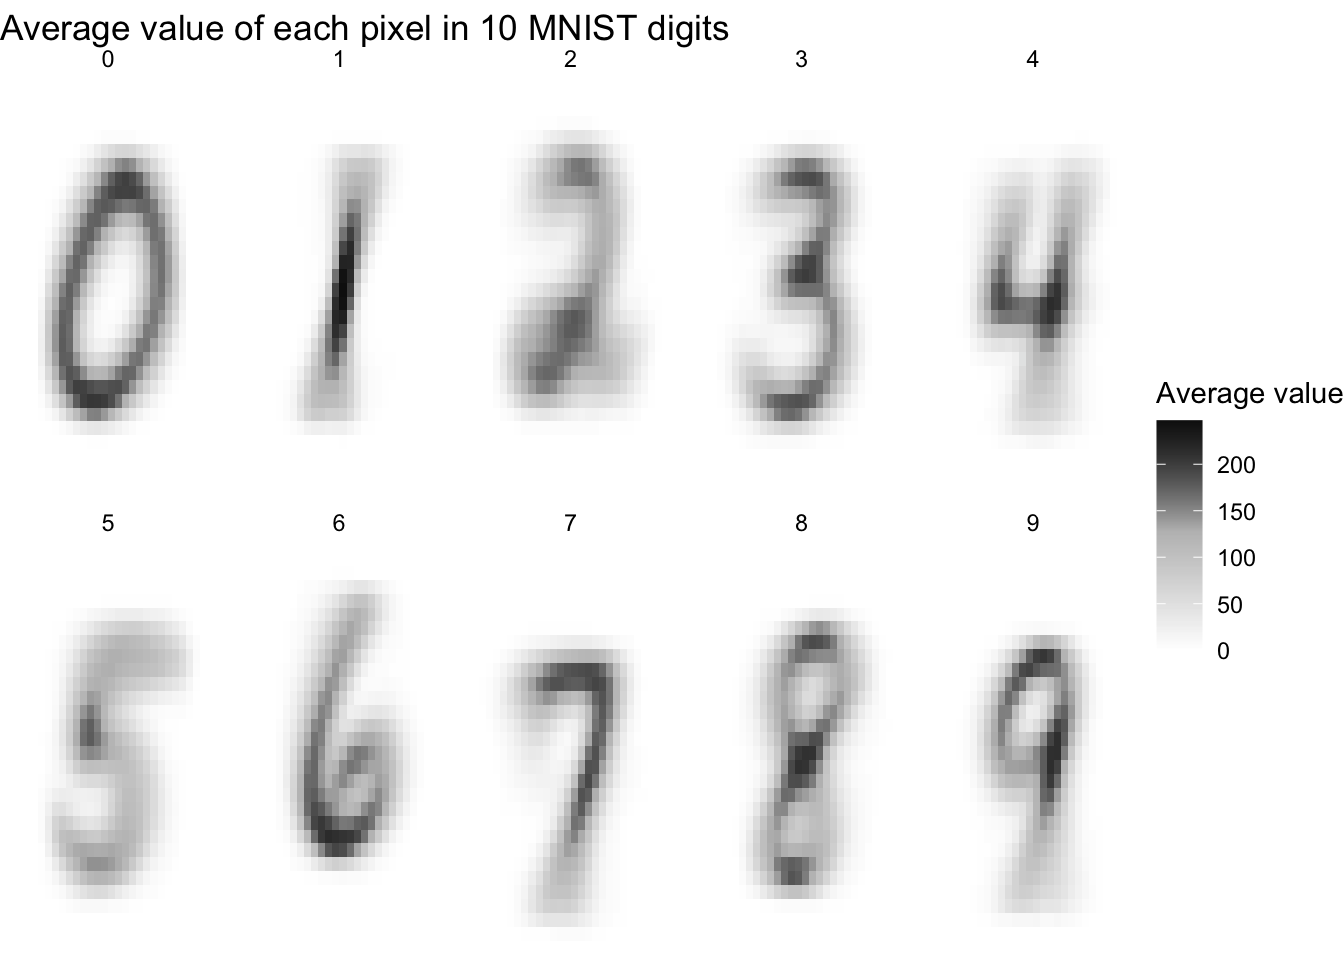
How much variability is there within each digit label? Do all 3s look like each other, and what is the “most typical” example of a 6?
To answer this, we can find the mean value for each position within each label and visualize these average digits as ten separate facets. These averaged images are called centroids. We’re treating each image as a 784-dimensional point (28 by 28), and then taking the average of all points in each dimension individually.
Solution
Before checking, analyze the chart and draw your own conclusions.
Already we have some suspicions about which digits might be easier to separate. Distinguishing 0 and 1 looks pretty straightforward: you could pick a few pixels at the center (always dark in 1 but not 0), or at the left and right edges (often dark in 0 but not 1), and you’d have a pretty great classifier. Pairs like 4/9, or 3/8, have a lot more overlap and will be a more challenging problem.
Which digits have more variability on average?
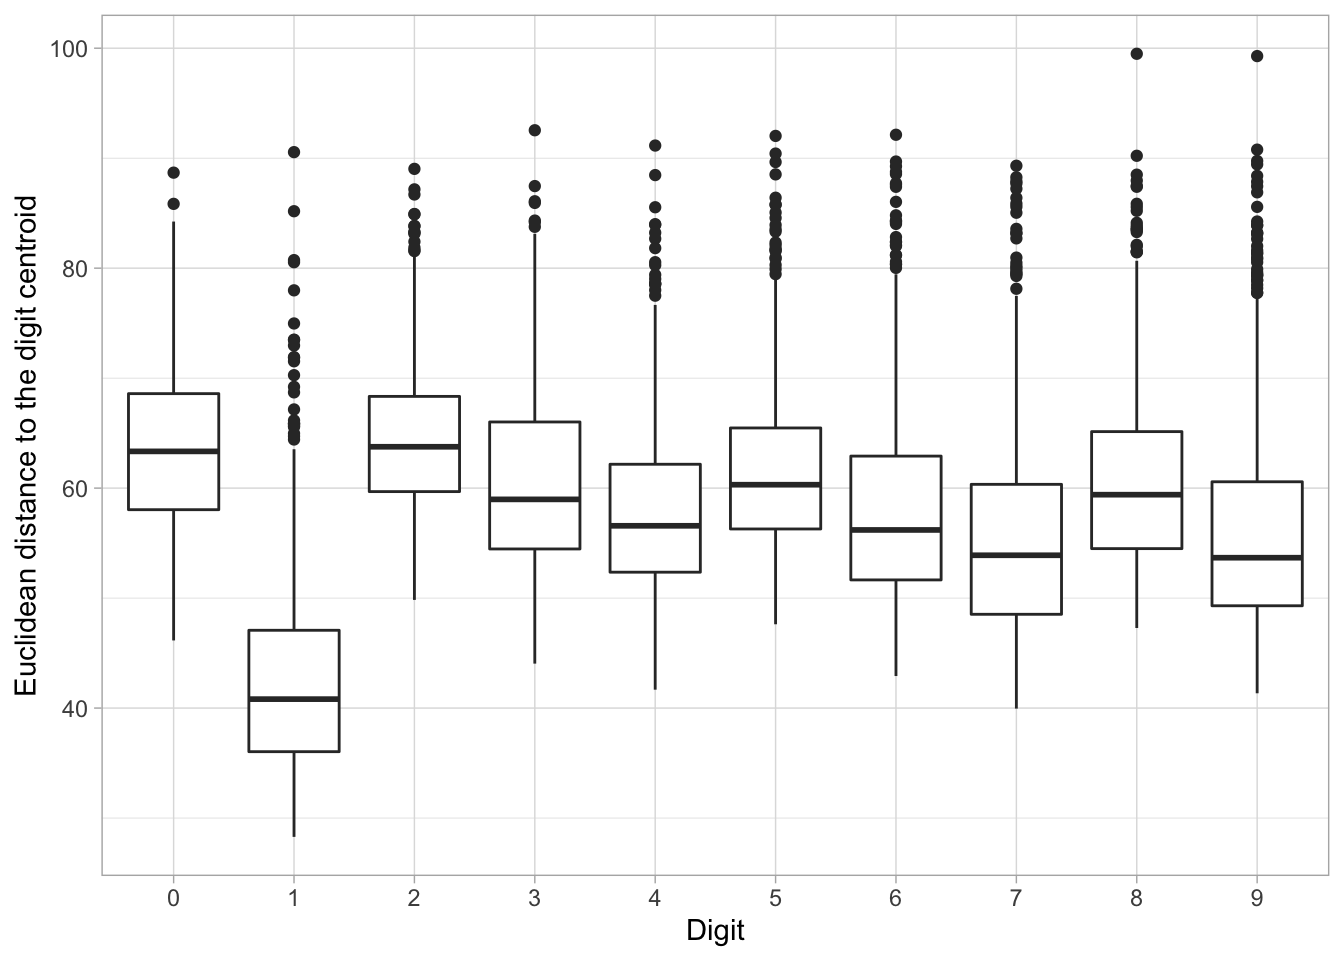
So far, this machine learning problem might seem a bit easy: we have some very “typical” versions of each digit. But one of the reasons classification can be challenging is that some digits will fall widely outside the norm. It’s useful to explore atypical cases, since it could help us understand why the method fails and help us choose a method and engineer features.
In this case, we could consider the Euclidean distance (square root of the sum of squares) of each image to its label’s centroid.
Solution
Before checking, analyze the chart and draw your own conclusions.
It looks like 1s have especially low distances to their centroid: for the most part there’s not a ton of variability in how people draw that digit. It looks like the most variability by this measure are in 0s and 2s. But every digit has at least a few cases with an unusually large distance from their centroid. I wonder what those look like?
To discover this, we can visualize the six digit instances that had the least resemblance to their central digit.
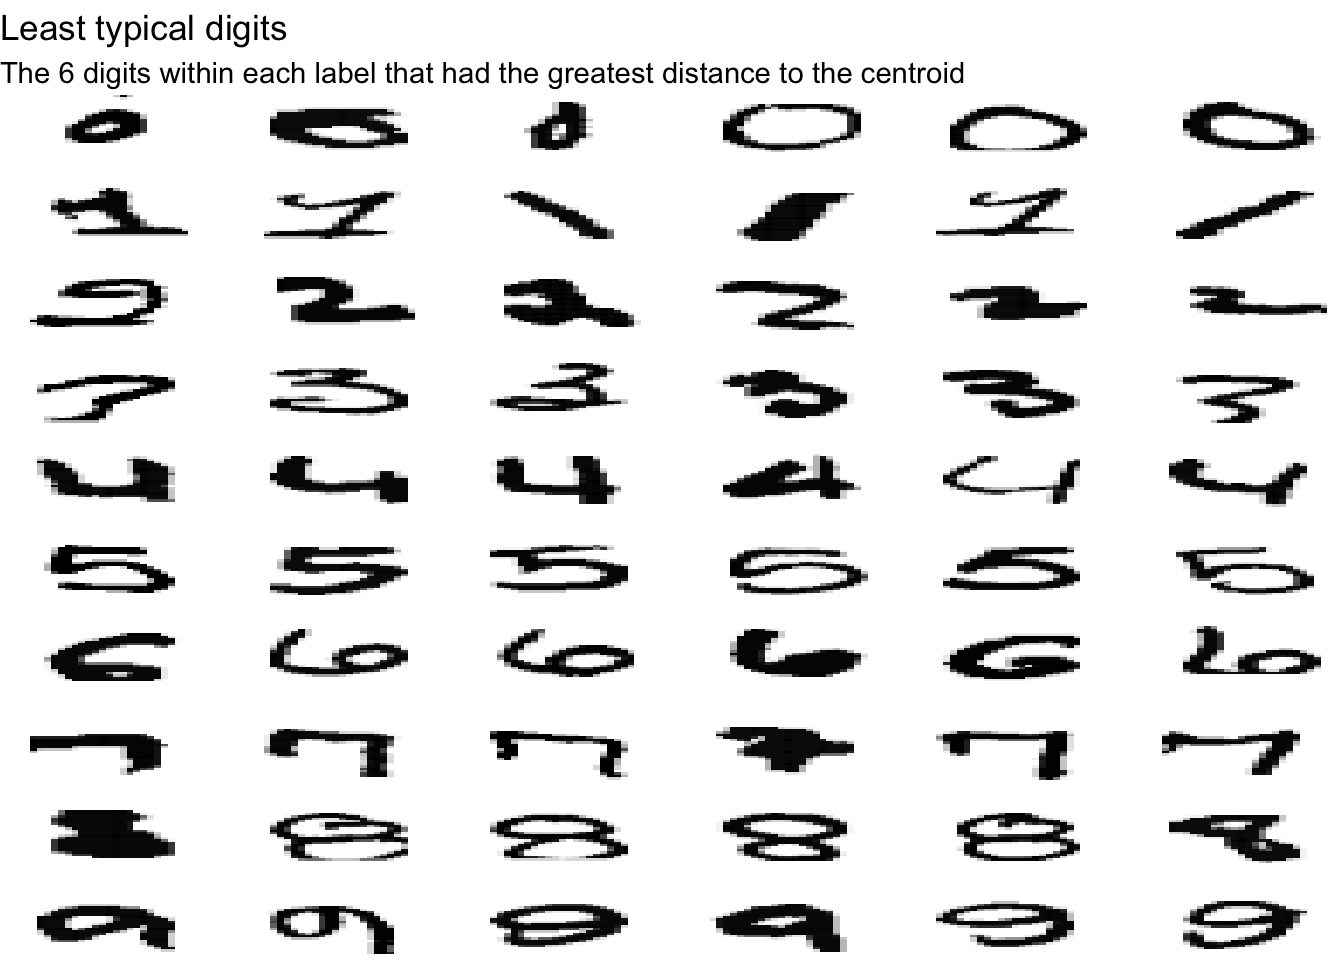
This is a useful way to understand what kinds of problems the data could have. For instance, while most 1s looked the same, they could be drawn diagonally, or with a flat line and a flag on top. A 7 could be drawn with a bar in the middle. (And what is up with that 9 on the lower left?)
This also gives us a realistic sense of how accurate our classifier can get. Even humans would have a hard time classifying some of these sloppy digits, so we can’t expect a 100% success rate. Conversely, if one of our classifiers does get a 100% success rate, we should examine whether we’re overfitting!How easy it is to tell pairs of digits apart?
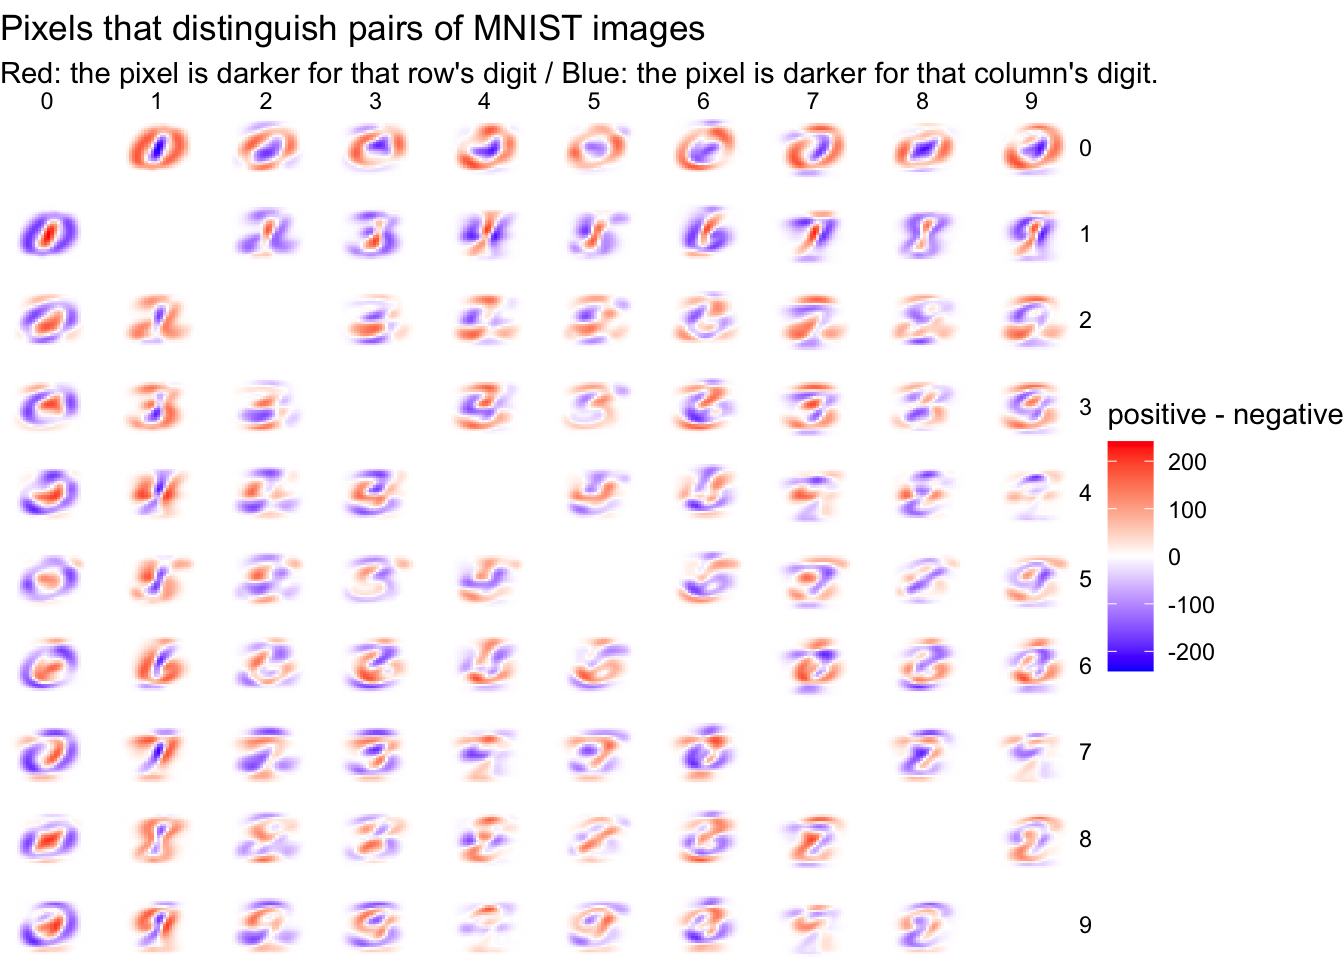
To examine this, we could try overlapping pairs of our centroid digits, and taking the difference between them. If two centroids have very little overlap, this means they’ll probably be easy to distinguish.
Solution
Before checking, analyze the chart and draw your own conclusions.
Pairs with very red or very blue regions will be easy to classify, since they describe features that divide the datasets neatly. This confirms our suspicion about 0/1 being easy to classify: it has substantial regions than are deeply red or blue.
Comparisons that are largely white may be more difficult. We can see 4/9 looks pretty challenging, which makes sense (a handwritten 4 and 9 really differ only by a small region at the top). 7/9 shows a similar challenge.2.3.4 Modeling and Evaluation
For modeling we can use a neural network. Follow this link and let thee model run. When finished you’ll see a table resembling the following:
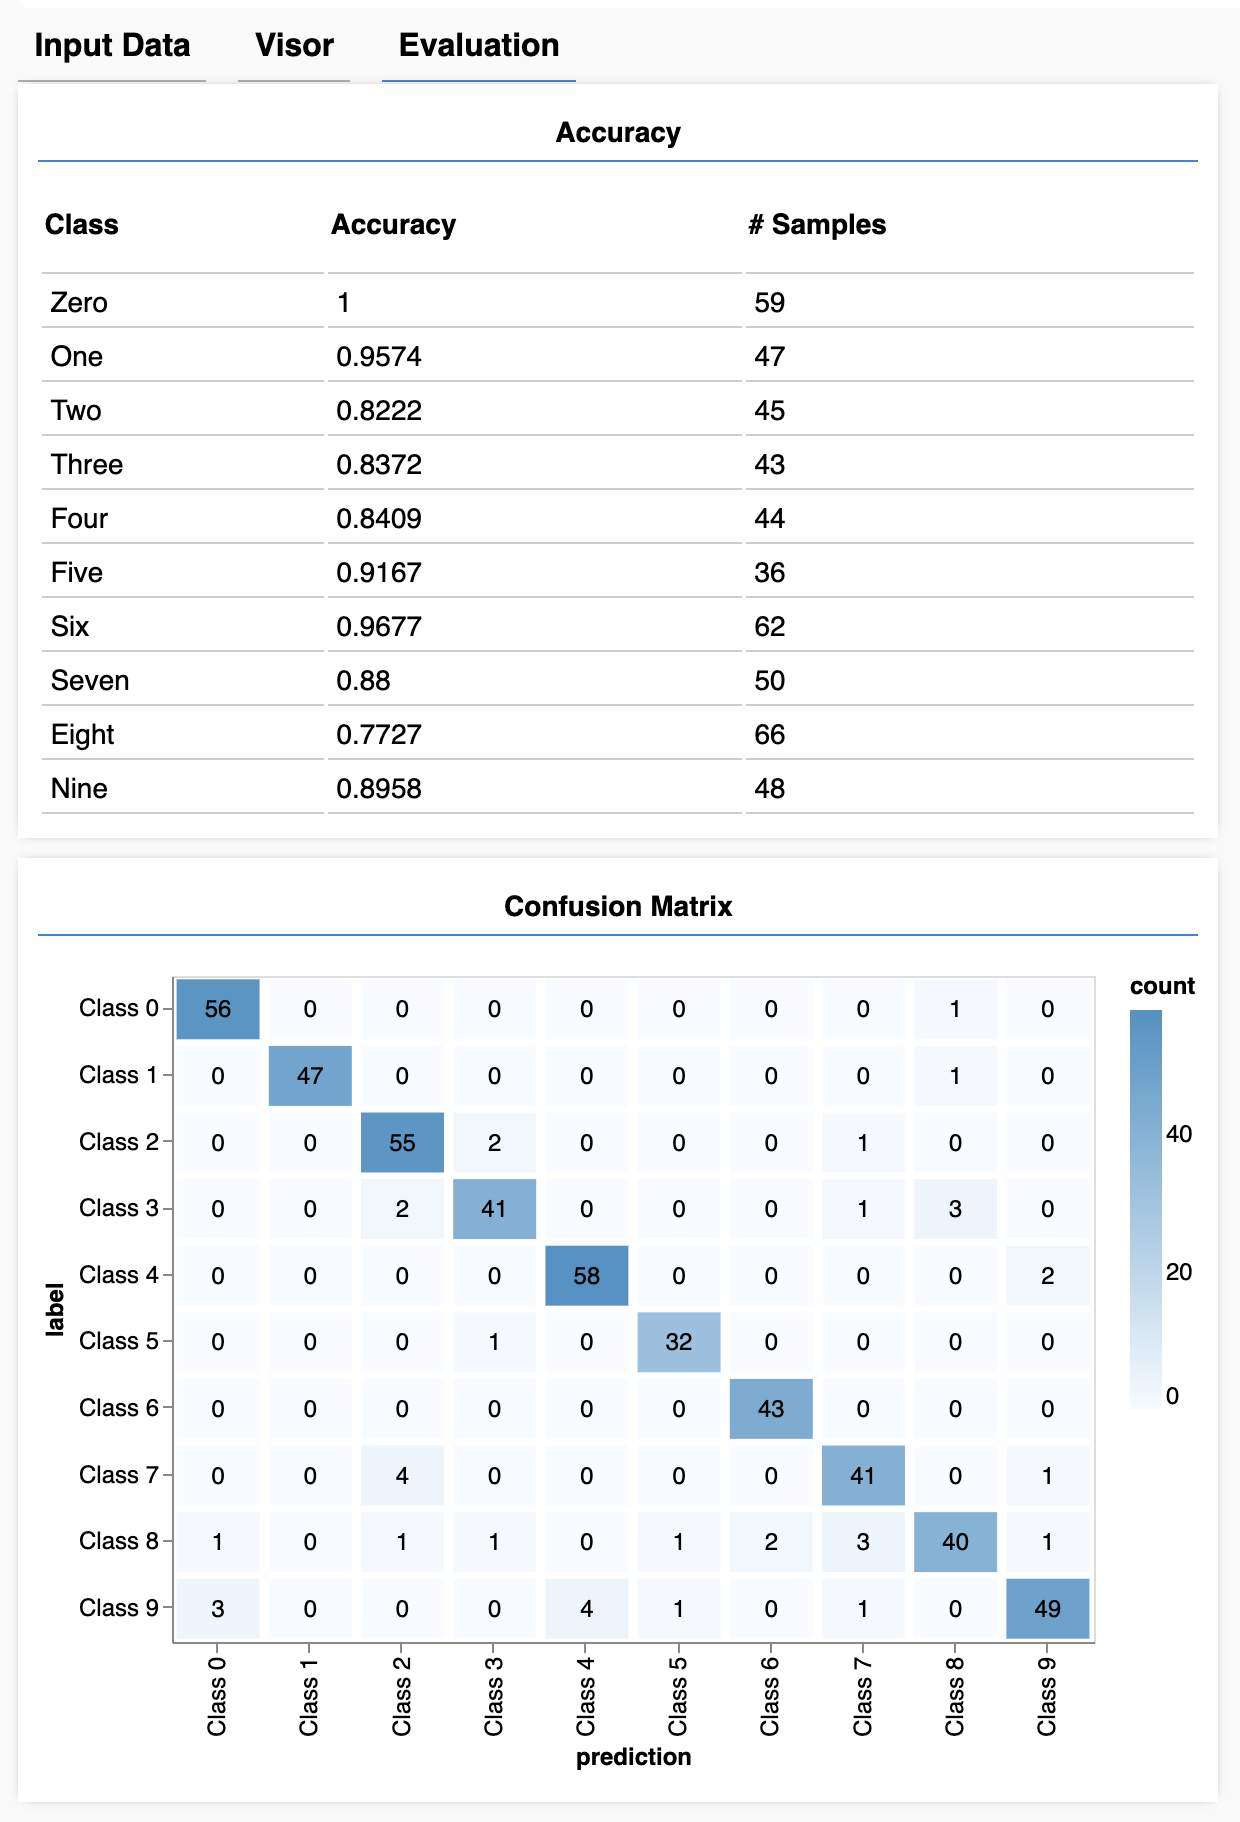
Figure 2.8: Example Machine Learning output
How well does the model perform?
2.4 Data Formats
2.4.1 SQL vs NoSQL
If you work with Excel or store your data in MySQL, you are used to storing data in rows and columns. For example, if you store customer data:
| First | Last |
|---|---|
| Witold | ten Hove |
| Caroline | Tensen |
Each line is a customer, each column a variable, and each cell contains one value.
However, suppose you want to store all of your customers’ phone numbers and some customers have multiple phone numbers. One option is to store all telephone numbers in one cell:
| First | Last | Telephone |
|---|---|---|
| Witek | ten Hove | 06111111; 06222222 |
| Caroline | Tensen | 06333333 |
However, this can cause a problem when exporting or searching the data. As soon as your data seems to become asymmetric, you should consider a NoSQL format. The most important formats in terms of popularity are XML and JSON.
2.4.1.1 XML
By annotating data, meaning can be added to individual data elements. One data format that makes use of this is Extensible Markup Language (XML). For example, in our example, a
##
## <customers>
##   <customer>
##     <First>Witek</First>
##     <Last>ten Hove</Last>
##     <Telephone>06111111</Telephone>
##     <Telephone>06222222</Telephone>
##   </customer>
##   <customer>
##     <First>Caroline</First>
##     <Last>Tensen</Last>
##     <Telephone>06333333</Telephone>
##   </customer>
## </customers>
Using this method we can easily add data. For instance a second name.
##
## <customers>
##   <customer>
##     <First>Witold</First>
##     <First>Frederik</First>
##     <Last>ten Hove</Last>
##     <Telephone>06111111</Telephone>
##     <Telephone>06222222</Telephone>
##   </customer>
##   <customer>
##     <First>Caroline</First>
##     <First>Egbertine</First>
##     <Last>Tensen</Last>
##     <Telephone>06333333</Telephone>
##   </customer>
## </customers>
2.4.1.2 JSON
For a long time XML was the leading data format for web applications. However is has currently been overtaken by Javascript Object Notation (JSON).

Figure 2.9: Source: Stack Overflow
Figure 2.10: Percentage web searches JSON vs XML
Source: Google Trends
The main reason for this change has been the increase in popularity of so-called Application Programming Interfaces (APIs). Many online service providers offer also the possibility to access selected data. Most modern web applications are written using Javascript and can process JSON natively.
This concept simplifies the integration of various data sources dramatically. For instance one application could combine tweets from Twitter with weather forecasts and with news from CNN.
JSON works through so-called key: value sets:
## [
##   {
##     "First": "Witold",
##     "Last": "ten Hove",
##     "Telephone": "06111111"
##   },
##   {
##     "First": "Caroline",
##     "Last": "Tefsen",
##     "Telephone": "06333333"
##   }
## ]
If a value consists of many elements these are stored in arrays.
## [
##   {
##     "First": ["Witold", "Frederik"],
##     "Last": "ten Hove",
##     "Telephone": ["06111111", "06222222"]
##   },
##   {
##     "First": ["Caroline", "Egbertine"],
##     "Last": "Tefsen",
##     "Telephone": "06333333"
##   }
## ]
The arrays are indexed, so each element can be easily retrieved.
2.5 Business Case
Big Data is not reserved for Big Business. In the following video you’ll see a case of a small retailer using data to improve his business decisions.
Answer the following questions. Use the information from the course literature as a starting point for your argumentation. Find other reliable sources that support your analysis.
- What was the business problem?
- How was it translated into a data mining problem?
- What is the realized business value?