Module 1 Data Driven Decision Making
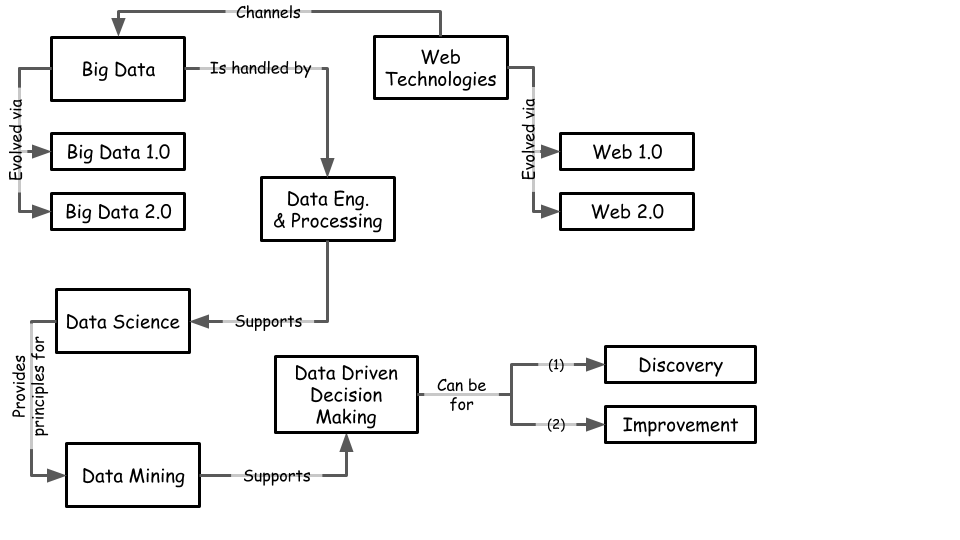
Figure 1.1: Lesson Map taken from Provost and Fawcett (2013)
1.1 Opening Business Case
The following video is not about a business case, but provides some valuable basic insights for data driven decision making. Please watch the first 15 minutes and then aswer the questions.
Assignments:
- Write down all associations you can discover between the study material (Provost Ch.1) and the video.
- Apart from data driven what are other methods for decision making?
1.2 Thinking and Deciding
1.2.1 The Johan Cruyff Arena

Figure 1.2: Johan Cuyff Arena Amsterdam taken from https://en.wikipedia.org/wiki/Johan_Cruyff_Arena#/media/File:Ajax_0_Chelsea_1_(23Oct19).jpg
.jpg)
Suppose someone drops a water drop in de Johan Cruyff Arena on the center spot, a second later two drops, after another second four drops, etc. How long would it take to flood the Arena?
Solution
Before checking, make your own estimate.
Figure 1.3: Simulation of Arena flooding - own work
Think: How well did you guess?
1.2.2 The Monty Hall Problem
Suppose you’re on a game show, and you’re given the choice of three doors: Behind one door is a car; behind the others, goats. You pick a door, say No. 1, and the host, who knows what’s behind the doors, opens another door, say No. 3, which has a goat. He then says to you, “Do you want to pick door No. 2?” Is it to your advantage to switch your choice?
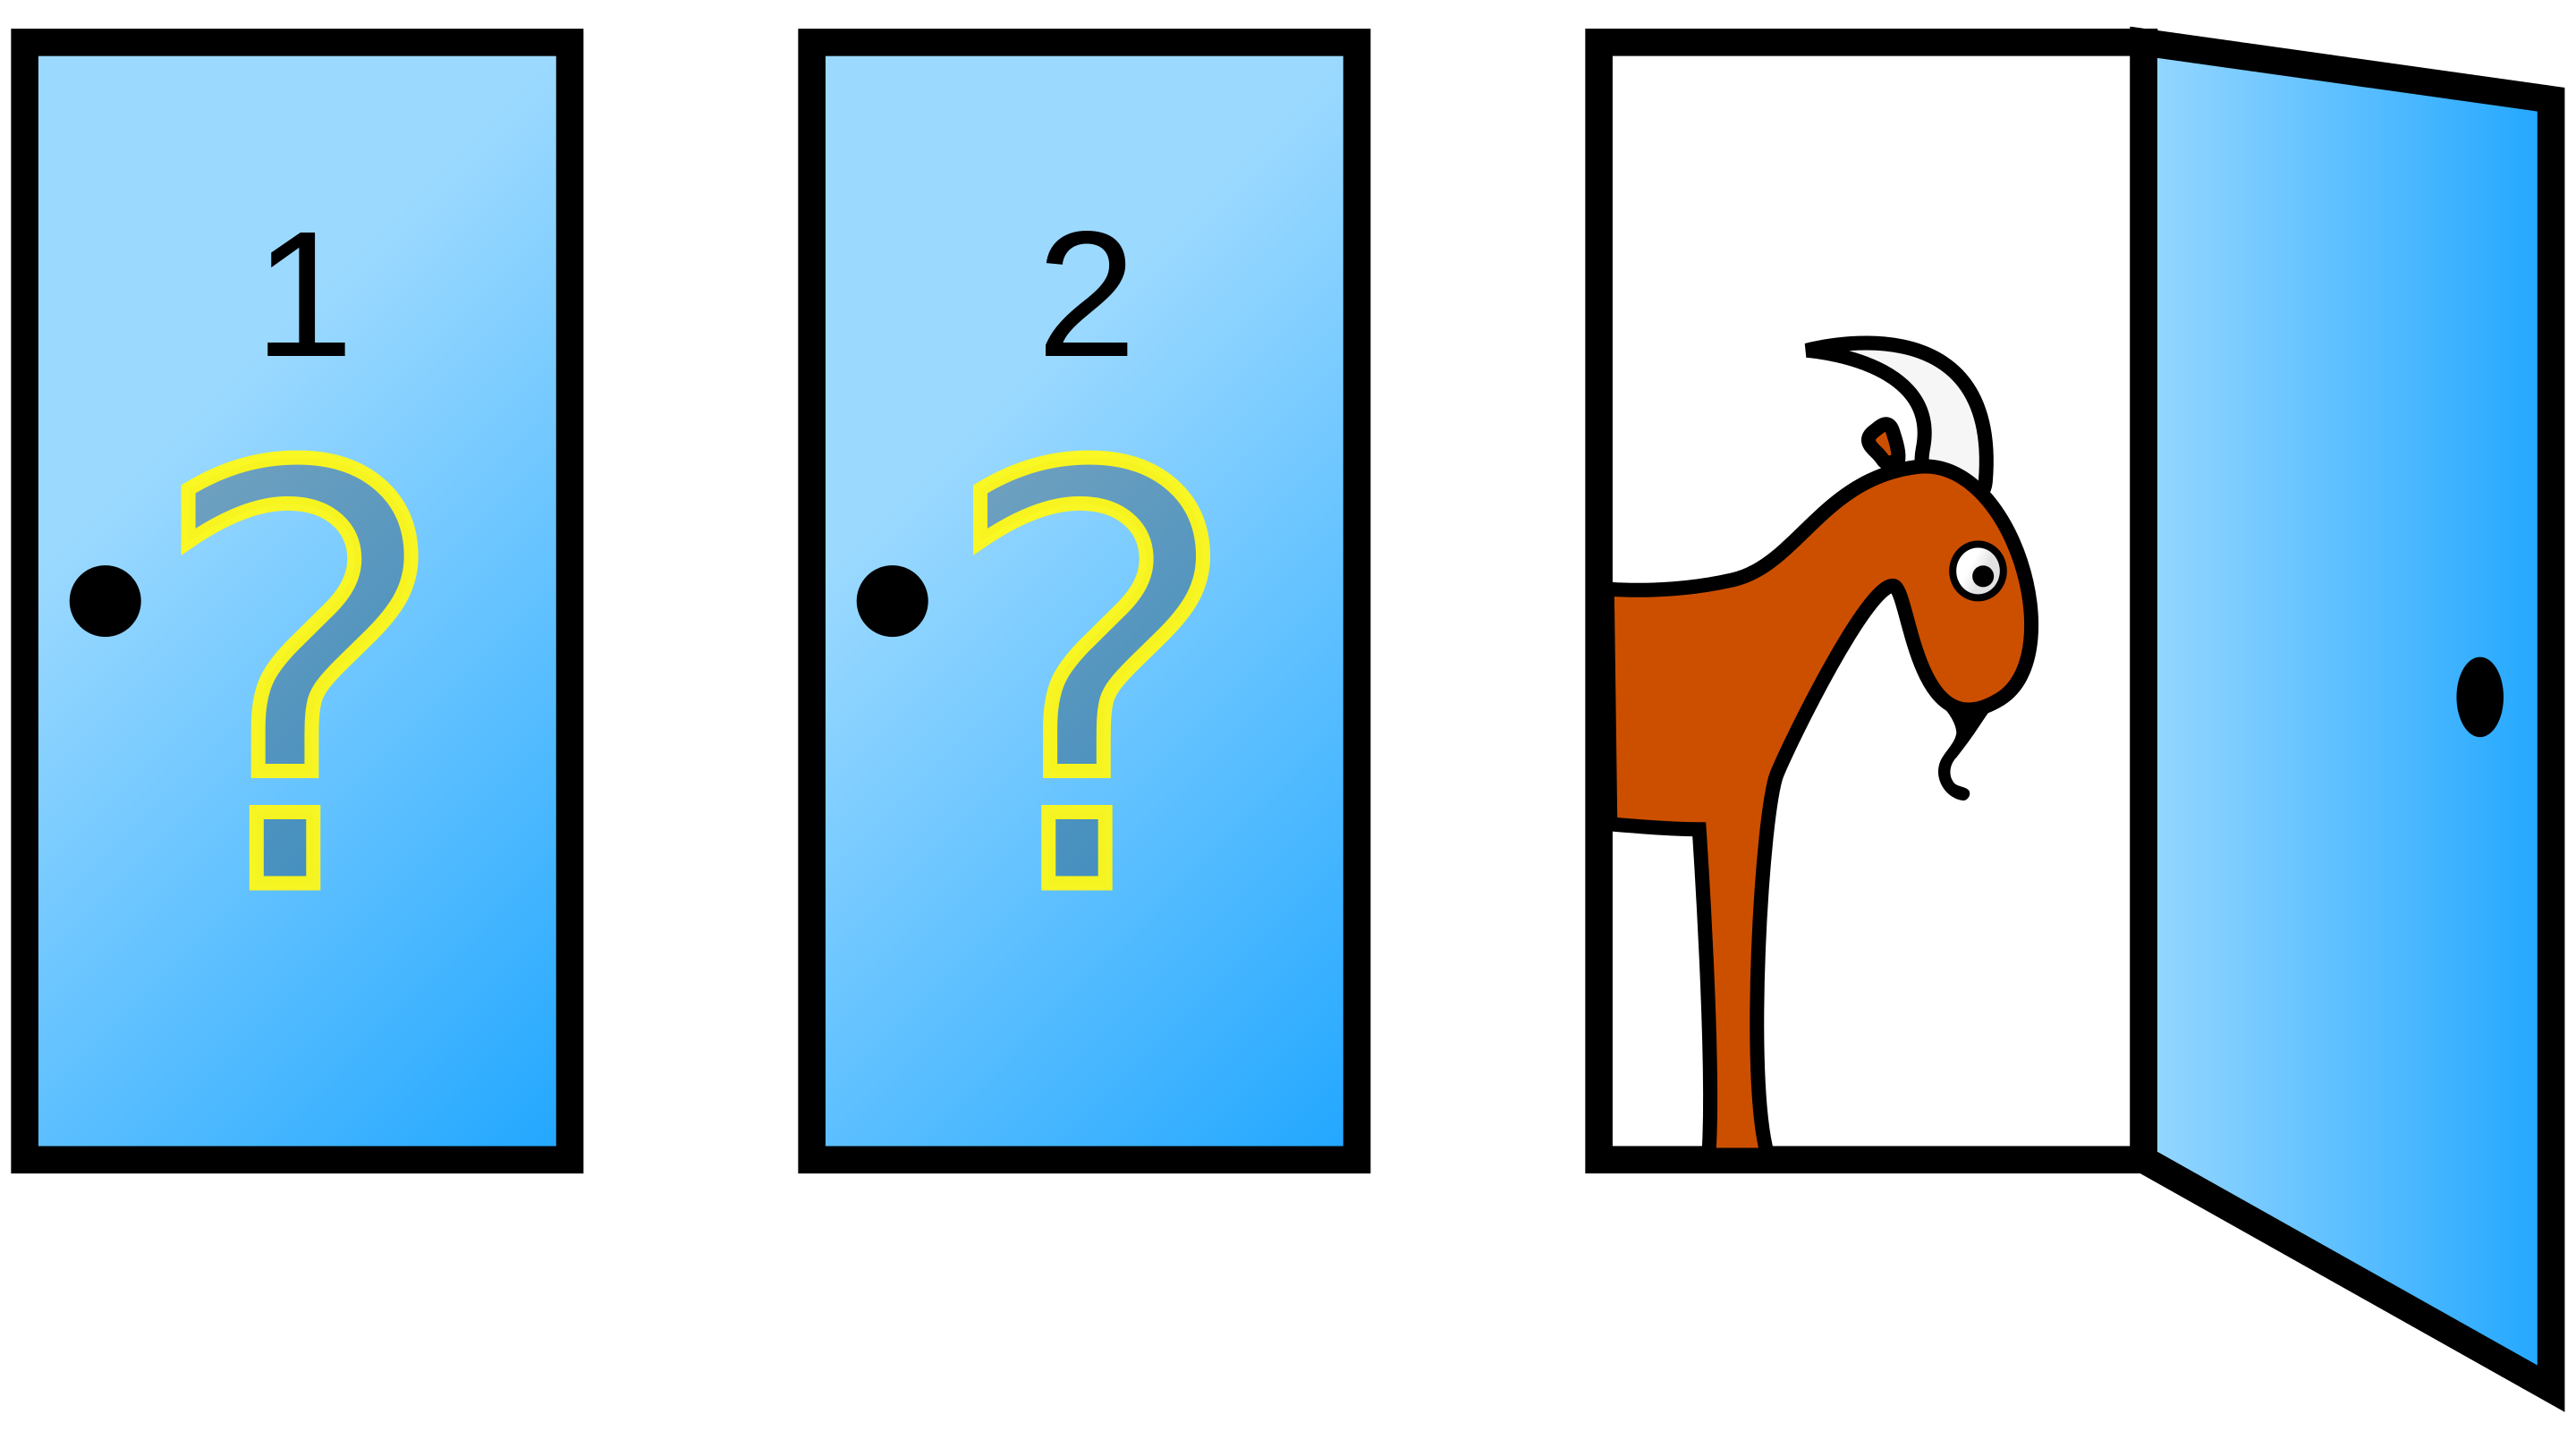
Figure 1.4: The Monty Hall Problem taken from https://en.wikipedia.org/wiki/Monty_Hall_problem
Solution
Before checking, try to derive a solution yourself.
Instead of trying to find an answer by reasoning we could write an algorithm that would play the game for us. Below you see one run.
## There are 3 doors: 0 0 1## Player chose door nr: 1 , with reward: 0## Host opens door. Remaining door has reward 1and the total wins when eached strategy is tried a 100,000 times.
Apparently you have a 67% chance of winning when switching doors.
Think: The problem was simple. Was it also a simple cognitive task? How much do you trust the solution above?
1.2.3 Taxicab problem
In a study done by Tversky and Kahneman (1981) subjects were given the following problem:
A cab was involved in a hit and run accident at night. Two cab companies, the Green and the Blue, operate in the city. 85% of the cabs in the city are Green and 15% are Blue.
A witness identified the cab as Blue. The court tested the reliability of the witness under the same circumstances that existed on the night of the accident and concluded that the witness correctly identified each one of the two colors 80% of the time and failed 20% of the time.
What is the probability that the cab involved in the accident was Blue rather than Green knowing that this witness identified it as Blue?
Solution
Before checking, try to derive a solution yourself.
- There is a 12% chance (15% times 80%) of the witness correctly identifying a blue cab.
- There is a 17% chance (85% times 20%) of the witness incorrectly identifying a green cab as blue.
- There is therefore a 29% chance (12% plus 17%) the witness will identify the cab as blue.
- This results in a 41% chance (12% divided by 29%) that the cab identified as blue is actually blue.
Again we could write a simulation where we present 10,000 cabs to the witness and let him assess the color. Below you see one run of the simulation and in the chart the total count per cab. The red color represents all the cabs that were wrongly assessed.
## Cab was B
##  and witness saw G
## cab observed
## "B" "G"According to the simulation the reliability of the witness when he states that he saw a blue cab is 43%.
Most subjects gave probabilities over 50%, and some gave answers over 80%. The correct answer is lower than these estimates.
Think: Suppose that at the start of the trial the Blue Taxi Company tells the judge that they are not guilty. The witness is heard. How much do you think this would influence the opinion of a typical person? How much do you think it should influence? Do you think all judges have the analytical skills to calculate probabilities?
1.3 What is Data Science?
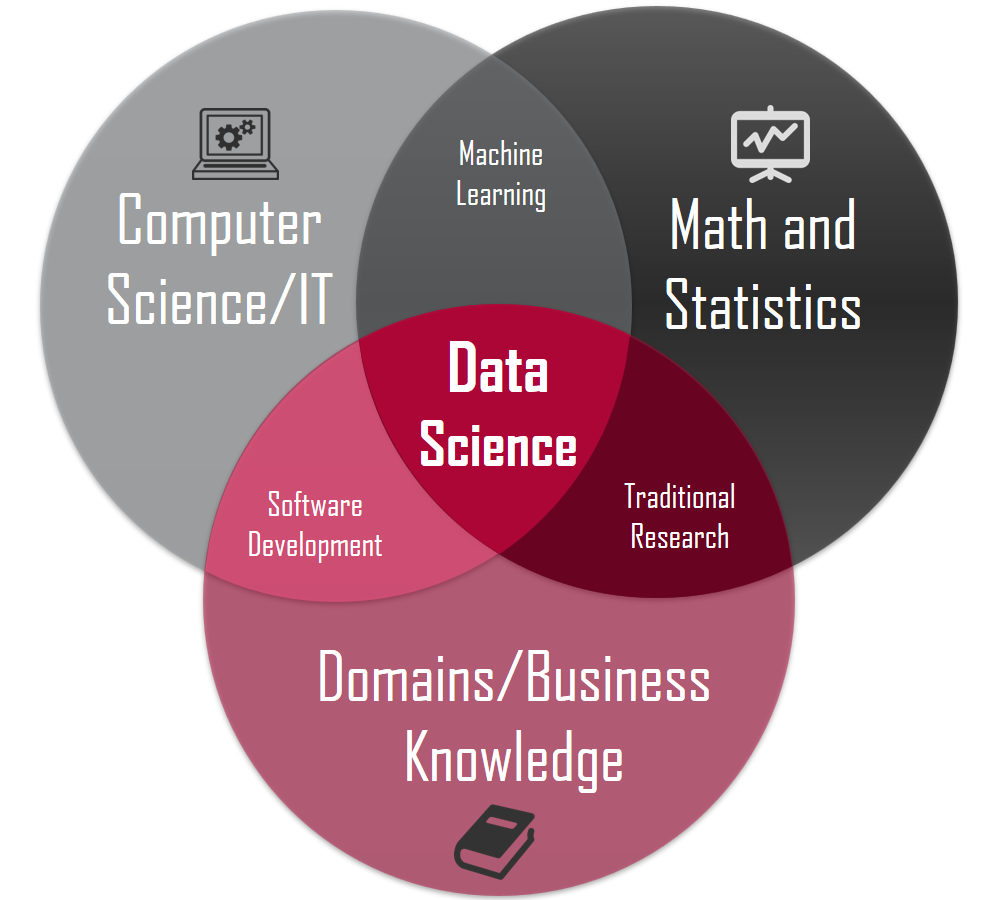
Figure 1.5: Data Science diagram taken from: https://towardsdatascience.com/introduction-to-statistics-e9d72d818745
Answer the following questions. Use the information from the course literature as a starting point for your argumentation. Find other reliable sources that support your analysis.
- Describe the difference and relationships between Data Analytics, Analysis and Science
1.4 What is Data Mining?
Figure 1.6: Cross-industry standard process for data mining taken from: https://commons.wikimedia.org/wiki/File:CRISP-DM_Process_Diagram.png
1.5 What is Data Driven Decision Making
Figure 1.7: DIKW pyramid taken from: https://en.wikipedia.org/wiki/DIKW_pyramid#/media/File:DIKW_Pyramid.svg
Figure 1.8: A process model for data-driven decision making taken from Lu, Cairns, and Smith (2020)
1.6 What are Big Data technologies?
Figure 1.9: Big Data pipelines taken from: https://blog.dataiku.com/technoslavia-the-fragmented-world-of-data-infrastructure-in-2020
1.7 Case Study: Ubernomics
Answer the following questions. Use the information from the course literature as a starting point for your argumentation. Find other reliable sources that support your analysis.
- Why was data driven decision making (3DM) useful in this business case?
- How did the organization apply 3DM?
- What can the organization do with 3DM that they couldn’t do before?