In calculus, the concept of a limit is fundamental. It forms the foundation for differentiation and integration, which are essential tools in fields ranging from engineering to economics. For business management and engineering students diving into data science, understanding limits can offer insights into how functions behave.
What is a Limit?
Informally, a limit describes the value a function approaches as its input (or variable) approaches a certain point. For instance, as \(x\) approaches the number \(a\), the limit of the function \(f(x)\) is the value \(f(x)\) gets close to.
Mathematically, we write this as:
\(\mathop {\lim }\limits_{x \to a} f(x) = L\)
Where \(L\) is the value the function is approaching.
Why is it Important?
Predicting Trends: In business, understanding where numbers are headed is crucial. By analyzing the limit of a function, you can predict future outcomes based on current data.
Rate of Change: For engineering projects, knowing how fast something is changing (like a temperature or a speed) can be essential. This rate of change is defined by derivatives, which are grounded in limits.
Code Example in Python
Let’s illustrate the concept of a limit using Python:
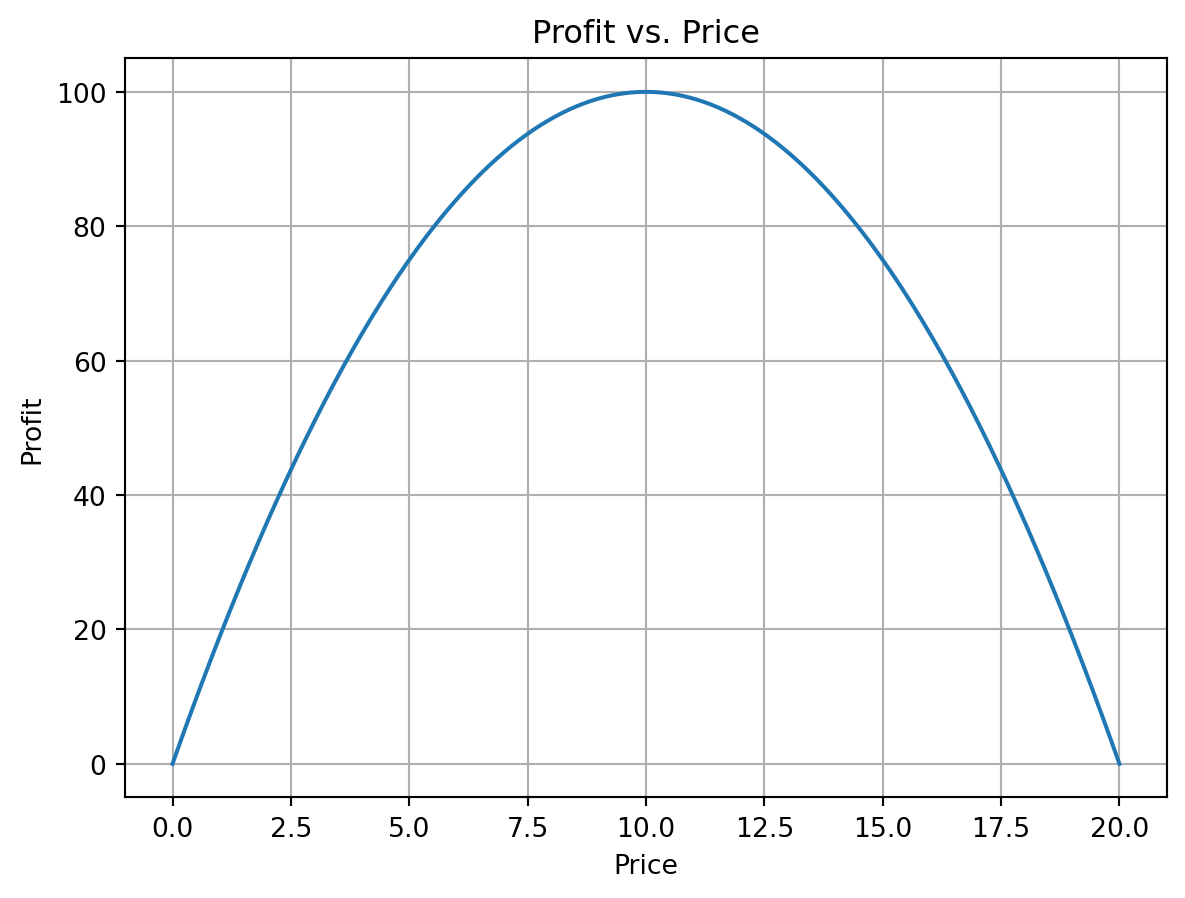
Consider a company’s profit as it increases its price for a product. Due to demand elasticity, there’s an optimal price after which profit starts to decrease. This can be modeled by a function like: \(f(p) = -p^2 + 20p\) Where \(p\) is the price of the product.
Code
import numpy as npimport matplotlib.pyplot as pltdef profit(p):return-p**2+20*pprices = np.linspace(0, 20, 400)profits = profit(prices)plt.plot(prices, profits)plt.title('Profit vs. Price')plt.xlabel('Price')plt.ylabel('Profit')plt.grid(True)plt.show()
The graph will show a peak profit. Using calculus and the concept of limits, we can determine the exact price that gives the maximum profit. This is futher discussed in the section on derivatives.